

Case Study: Increasing Grinding Line Output by Cutting Air‑Cutting Time and Downtime
How real-time monitoring of a grinder motor helped a bearing plant convert air-cutting and downtime into productive grinding time and higher output.

The plant faced three key issues:
Challenge
A leading bearing manufacturer operates precision grinding machines at one of its plants, where every minute of effective grinding time directly impacts total bearing output. Despite having robust equipment, the plant suspected that significant time was being lost to "air cutting" — where the spindle runs without removing material — and to avoidable machine downtime. The operations team wanted to increase production from existing grinding assets without adding new machines or extra shifts.
Manufacturing Context
No detailed, real-time view of how much time the grinder spent in actual cutting versus air cutting.
Limited visibility into the true extent and root causes of machine downtime across days and shifts.
No objective way to compare the actual grinding load curve against an ideal curve to identify process improvement opportunities.

The plant deployed an IIoT 4.0 asset-level monitoring solution on a critical grinding machine, covering the main grinder motor, hydraulic power pack, and hydraulic pump motor. The solution delivered four core capabilities:
Real‑Time Asset‑Level Monitoring
Continuous power monitoring: Real-time measurement of power consumption on the grinder motor, building a detailed time series of machine behaviour throughout each shift.
Automatic machine state classification: Analytics distinguished between active grinding, air cutting, and downtime based on power signatures — with no manual logging required.
Event and time-series analysis: Daily charts and timelines allowed the team to correlate patterns with changeovers, maintenance activities, planning gaps, or manpower issues.
Ideal vs. actual grinding curve comparison: The platform compared actual grinding load curves against an ideal profile to highlight optimisation opportunities in infeed speed and rapid approach distance.
This transformed the grinder from a black box into a transparent, data‑rich asset.

Key Insights
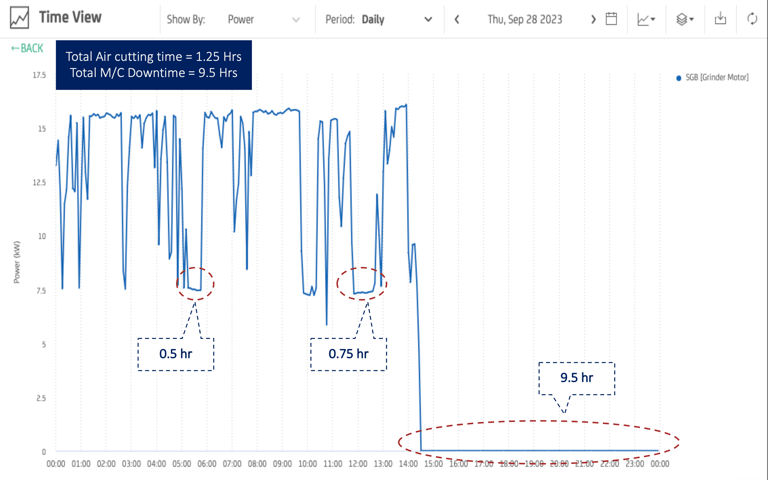
Machine downtime: Over a 10-day period, the machine recorded 63+ hours (approximately 2.6 days) of downtime — equivalent to roughly 26% of available operating time.
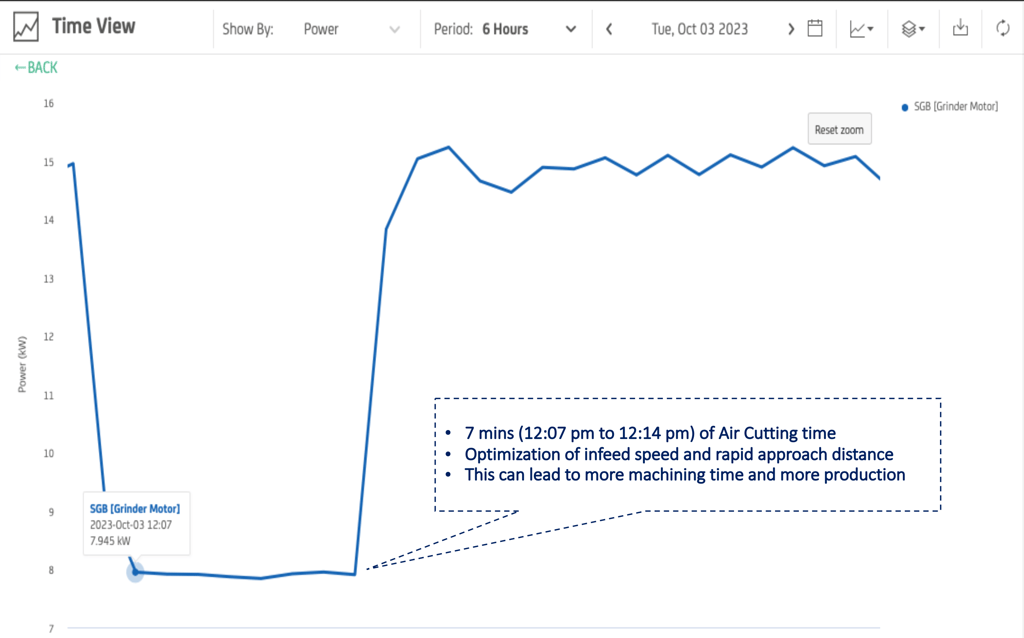
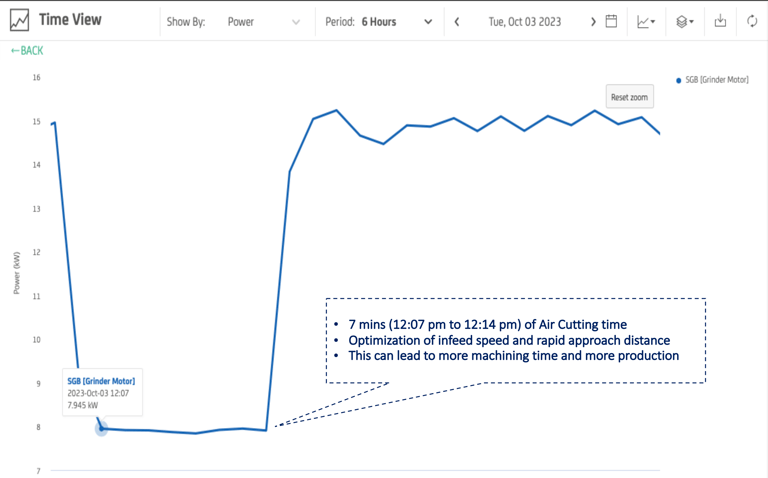
Abnormal load spikes: While the grinder motor typically consumed under 17 kW, power spiked to 25+ kW on at least one occasion. Such spikes are associated with excessive feed rates and carry the risk of damaging the grinding wheel surface and causing workpiece quality defects. In some cycles, approximately 7 minutes of air cutting were also observed during the approach phase (for example, between 12:07 and 12:14), suggesting that optimising rapid approach distance and infeed speed could directly recover productive grinding time.
The real-time data revealed significant improvement potential across four areas:
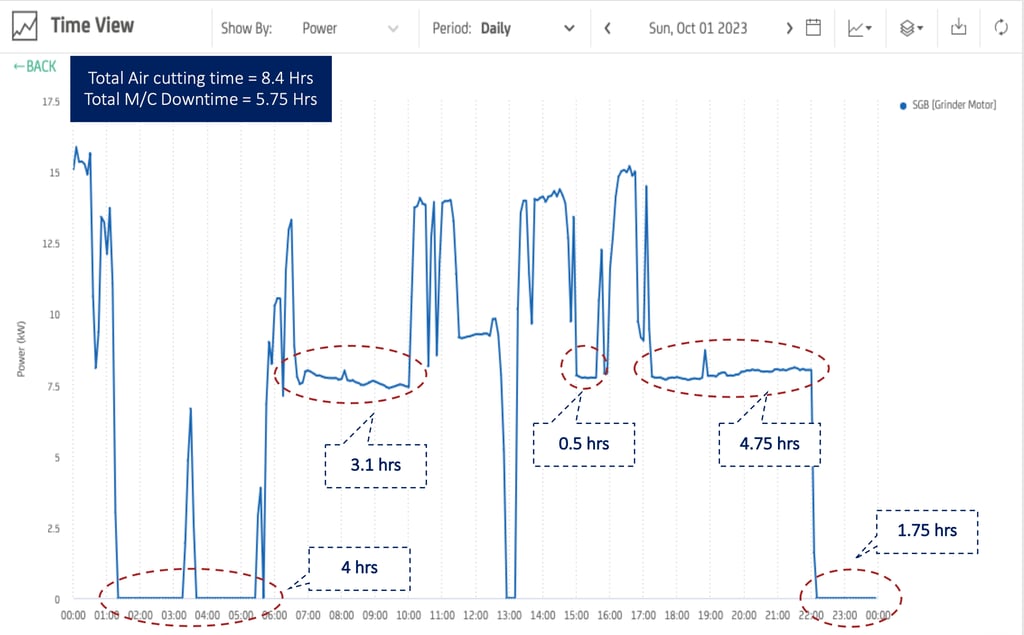
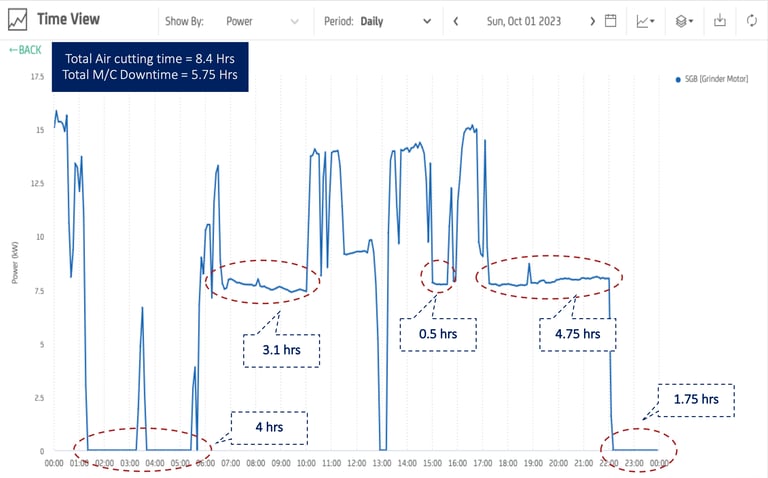
Air-cutting time: Over a 7-day period, the grinder spent 40+ hours (approximately 1.7 days) in air cutting, representing around 24% of spindle running time with no material removal.
Unnecessary pump operation: The hydraulic pump was frequently running even when the grinder motor was off, indicating energy waste and avoidable wear on auxiliary equipment.

Optimise process parameters: Adjust infeed speed and rapid traverse distances to bring the actual grinding load curve closer to the ideal profile, improving both productivity and part quality.
Actions and Improvements
Armed with these insights, the plant engineering and production teams could take targeted action:
Reduce air-cutting time: Set specific targets to convert idle spindle time into productive cutting time across days and shifts.
Investigate high-downtime days: Correlate time-series patterns with ground-level events such as changeovers, maintenance delays, or planning gaps to address root causes.

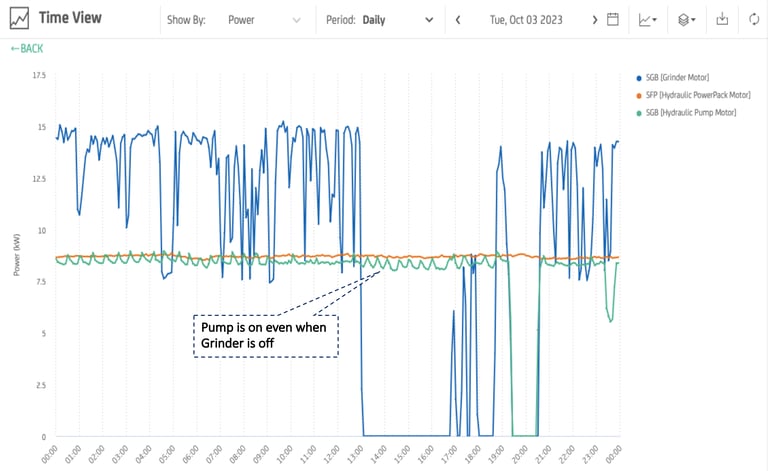
Switch off auxiliary equipment when idle: Ensure hydraulic pumps are turned off when the grinder is not running, reducing unnecessary energy consumption and equipment wear.
Address abnormal load spikes proactively: Monitor and act on power spikes before they damage grinding wheels or result in quality rejects.

Benefits Delivered
Reduced machine downtime through asset-level visibility into when and why the grinder is not cutting.
Protected grinding wheel and product quality by flagging abnormal power spikes before they cause surface damage or defects.
Increased effective grinding time by identifying and eliminating air-cutting periods through real-time power and time-series analysis.
Optimised grinding parameters by comparing actual load curves against ideal profiles for more efficient machining.
Lower energy waste and auxiliary wear by detecting when pumps and auxiliary motors run unnecessarily while the grinder is off.