

Case Study: Real-Time Production Tracking Reduces Hidden Losses on a CNC Line
How a high-volume automotive machining line kept missing output targets despite modern equipment and experienced operators.

Before digital tracking, production performance was measured mainly through manual counting and shift-level summaries. This created three major gaps:
The Visibility Problem
A Tier-1 automotive components manufacturer operates multiple CNC machining lines for engine components at one of its plants. One finish pin-hole boring line (Takisawa CNC) consistently under-delivered against its planned daily output of 1,842 units, even though demand and upstream supply remained stable. Management suspected the problem was not capacity on paper, but hidden performance losses on the shop floor — idle time, downtime, and inconsistent operator performance that did not surface clearly in traditional reports.
Manufacturing Context
No real-time visibility: Counts were verified only at the end of the day. If output dropped mid-shift, there was no mechanism to detect and correct it in time.
Hidden time losses: Idle time between cycles, extended cycle times, and downtime periods were not captured accurately, leaving no objective view of where production time was being lost.
Unclear shift and operator differences: It was difficult to compare shifts and operators fairly, or to understand why certain combinations consistently performed better than others.

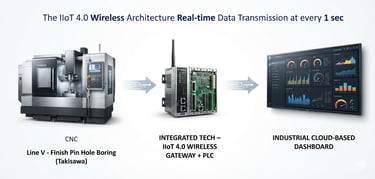
To address these gaps, a real-time production tracking solution was deployed on the CNC line using an IIoT 4.0 wireless architecture, delivering second-by-second visibility into production counts, cycle time, idle time, and downtime.
Solution: Real-Time IIoT Tracking
A wireless gateway was connected to the CNC machine to acquire signals without interfering with existing control logic.
Production data — including cycle start/stop, unit count, and machine status — was transmitted to the cloud every second, providing high-resolution visibility of machine activity throughout the day.
A cloud-based dashboard visualised live production counts, cycle time, idle time, downtime, and shift output for both supervisors and operators.


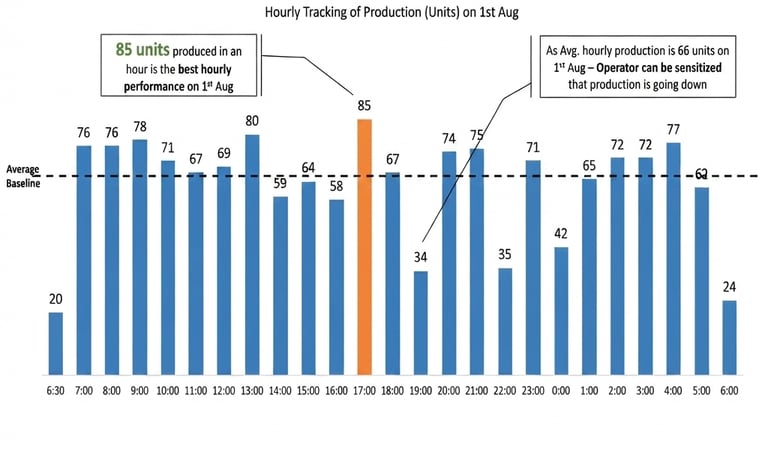
What The Numbers Revealed
Best hourly output: 85 units — establishing a realistic benchmark for what the line could achieve.
Average hourly output: 66 units, with clear peaks and troughs across the day.
Once real-time tracking was active, the line's true performance profile became clear:
Real-time intervention: Because data refreshed every second, supervisors could detect when hourly production was drifting below average and alert operators immediately, enabling mid-shift corrections rather than end-of-day reviews.

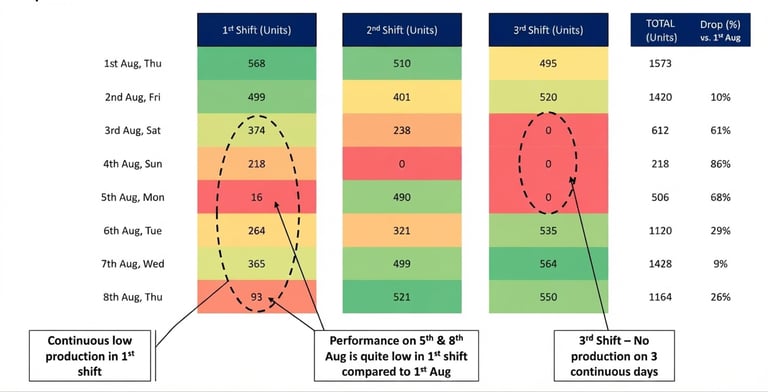
Shift and Operator Performance
The system enabled shift-wise tracking and heat-map visualisations of performance across the monitoring period.
On 1 August, total output of 1,573 units was distributed across three shifts, with clear differences in performance between them.
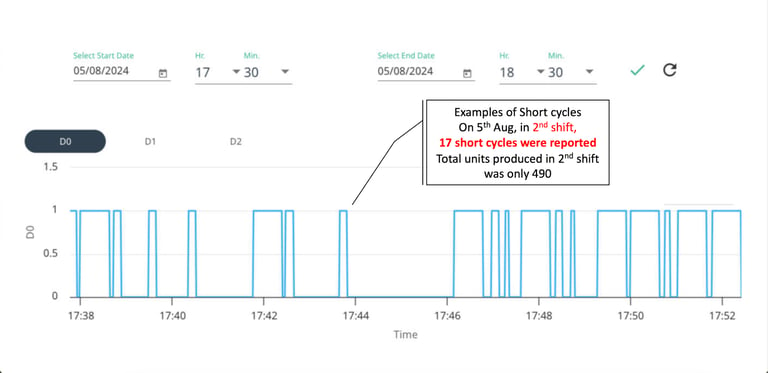
On 5 August, the second shift achieved 490 units, while the first shift delivered only 16 units and the third shift recorded zero output — revealing a stark imbalance in utilisation across shifts.
Heat maps across the full period revealed continuous low production in the first shift on certain days, very low output on 3–5 August compared to 1 August, and zero-output periods in the third shift on multiple days.


Short cycles: On 5 August during the second shift, 17 short cycles were recorded while total shift output was only 490 units. Short cycles pointed to operator interventions or process anomalies that warranted direct investigation.
Idle Time, Cycle Time, and Short Cycles
Beyond unit counts, the system captured the granular time-based losses that collectively eroded throughput:
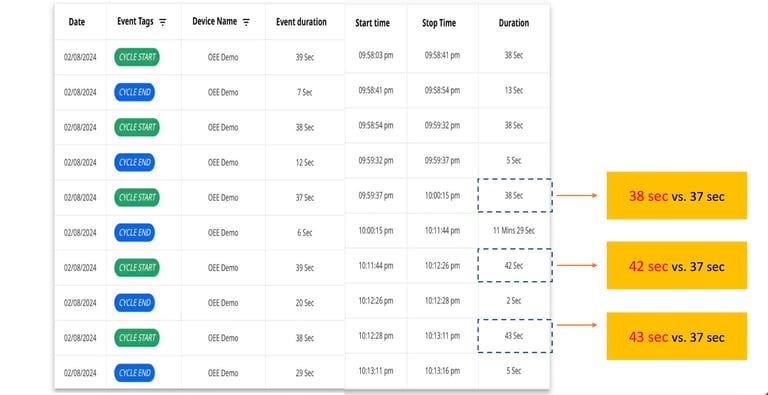
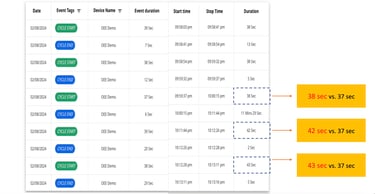
Cycle time drift: Cycle times of 42–43 seconds were frequently observed against a target of 37 seconds. Even a 5–6 second drift per cycle, repeated over hundreds of cycles, translated into significant lost production by end of shift.
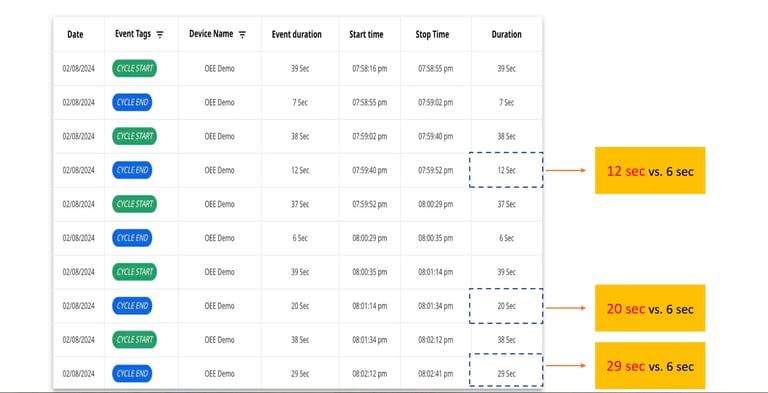
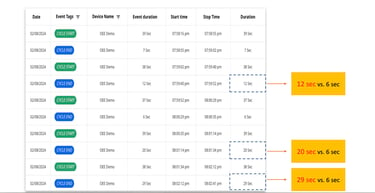
Excessive idle time: Idle times of 20–29 seconds between cycles were regularly recorded against a target of 6 seconds — indicating that the machine was ready but not running for far longer than planned.

By converting second-by-second machine data into clear production insights, the project gave the plant a practical, always-on mechanism to expose hidden losses and act on them quickly:
Benefits Delivered
Real-time production visibility: Supervisors and operators could see live counts and performance status, enabling corrective action within the shift rather than after it.
Cycle time control: Continuous cycle time monitoring made it possible to detect and address drift before it compounded into significant daily losses.
Reduced production loss: Tracking each machine's output in real time created accountability and allowed immediate intervention when output began to slip.
Operator performance transparency: Shift-wise and operator-level data replaced guesswork with objective, comparable performance records.
Idle time and downtime reduction: Quantified idle and downtime data gave maintenance and operations teams a clear target to act on.