

Case Study: Energy Optimisation in a Leading Pharmaceutical Manufacturing Company
How a leading pharmaceutical manufacturing company used IIoT monitoring to understand compressor and chiller performance, cut avoidable energy use, and build a carbon baseline.

The plant faced four core issues:
Challenge
A pharmaceutical manufacturing plant operating in a major industrial hub relies heavily on compressed air and chilled water systems as critical utilities for production. Compressed air systems and chillers represented a significant share of the plant's total energy consumption, yet operational decisions were based mainly on monthly utility bills and manual observations — leaving the site with little real-time visibility into how these assets were actually performing.
Customer Overview
No continuous visibility into the loading and energy consumption of individual compressors and the chiller.
Limited ability to correlate daily and weekly energy use with production schedules to identify avoidable losses.
Risk of motor overloading, peak load penalties, and unplanned failures due to undetected anomalies in current, loading, and phase balance.
Lack of machine-level carbon footprint data, making it difficult to establish a baseline and track emissions trends over time.
To support its cost-optimisation and decarbonisation goals, the site deployed an IIoT 4.0 wireless monitoring solution on key utility equipment.

A wireless, circuit-level IIoT system was installed on one chiller and two air compressors. The installation included one power sensor on the chiller and three current sensors on each compressor, enabling continuous measurement of power draw, current, loading, and energy consumption.
Solution
Benchmark the operating cost per hour for each compressor and compare cost, loading, and usage patterns.
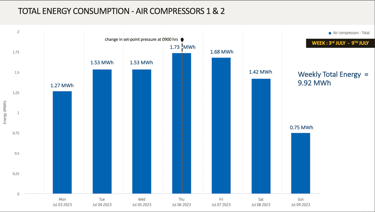
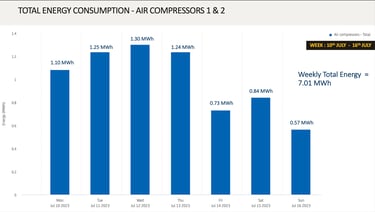
Analyse weekly and daily energy consumption for both compressors and the chiller, including week-over-week variance and heat maps.
Detect anomalies such as overloading, excess consumption, current spikes, phase imbalance, and frequent chiller motor cycling.
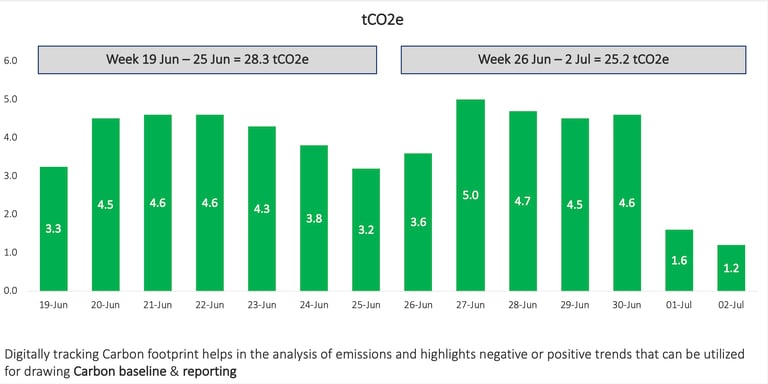
Estimate weekly machine-level carbon emissions to support carbon baselining and benchmarking across sites.
This setup allowed the team to:

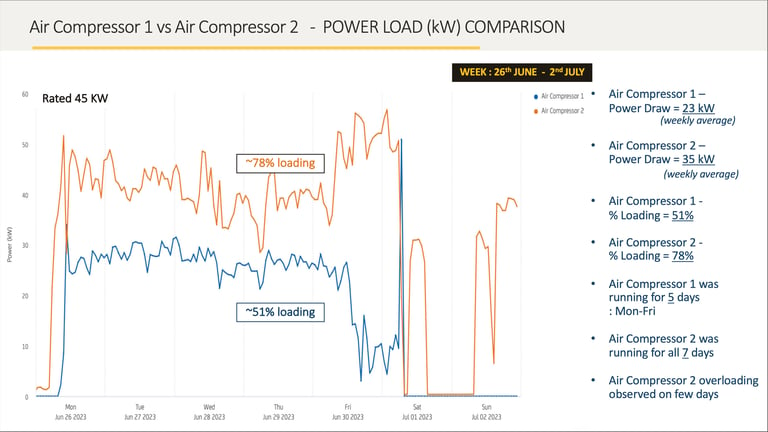
Impact of pressure setpoint changes: Reducing the compressed air pressure setpoint from 6.8–7.3 bar to 6.5–7.0 bar was directly correlated with a measurable reduction in power draw across both compressors, demonstrating the energy impact of setpoint optimisation.
Key Findings
The monitoring solution uncovered several important insights.
Under- and over-loading: One compressor was consistently under-loaded across multiple weeks, while the other frequently operated at 78–96% of rated capacity and at times exceeded 100%, indicating an overloading and reliability risk.
Compressor cost and loading imbalance: One compressor carried an operating cost approximately 28% higher per hour than the other, while also running roughly 70% more hours in the same month — a clear indication of suboptimal load distribution.
Carbon footprint visibility: Weekly carbon emissions from the monitored machines were estimated at approximately 25–28 tCO₂e, giving the plant a quantitative baseline for future decarbonisation efforts.
Peak load and chiller behaviour: Current spikes on the chiller (reaching up to 542 A) were linked to increases in site peak load. Events such as frequent chiller motor cycling and phase imbalance were identified as early warning signs requiring corrective action.
Large energy variance: Weekly energy consumption showed significant swings, with some weeks recording reductions greater than 70% and others showing large increases — highlighting opportunities to optimise loading, scheduling, and pressure setpoints.


Lower overload and failure risk: Continuous monitoring pinpointed periods when compressors and the chiller operated at or above rated capacity, giving maintenance teams early warning to act before issues escalated into failures.
Results and Benefits
By combining continuous monitoring with detailed energy analytics, the project delivered clear, actionable opportunities for optimisation and risk reduction:
Energy cost optimisation: Shifting load away from the higher-cost, heavily utilised compressor toward the lower-cost unit — and optimising operating hours — identified a clear path to reducing monthly compressor energy costs.
Improved peak load management: Understanding each machine's contribution to site peak demand enables targeted actions to reduce peak load charges and smooth overall demand profile.
Data-driven decarbonisation: Machine-level carbon estimates and week-over-week variance analysis provide a solid, quantified baseline to track the impact of future energy and emissions reduction projects.